Sample name: Infected (I) leaves – 13th Day of Contagion: Trees infected with fire blight in the greenhouse of the Institute of Horticulture in Skierniewice. FITOEXPORT project, 2019.
| Date of measurement: 2019-08-13
Type of measurement: Reflectance |
Data: Download CSV File.
M2INAVI ID: 121 |
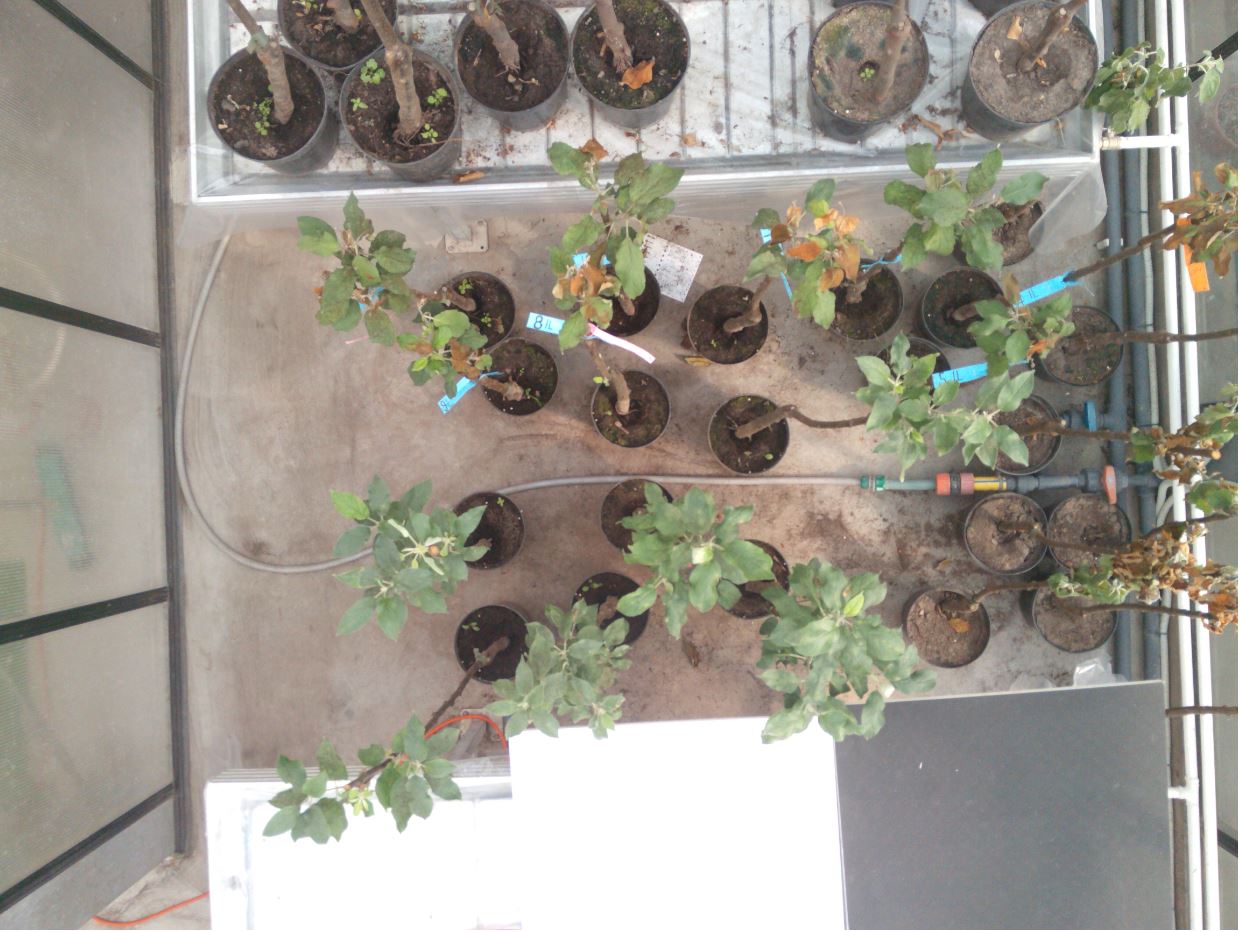
Healthy (H) and Infected (I) trees (lower group), 13th Day of Contagion. Spectral range 460-760nm |
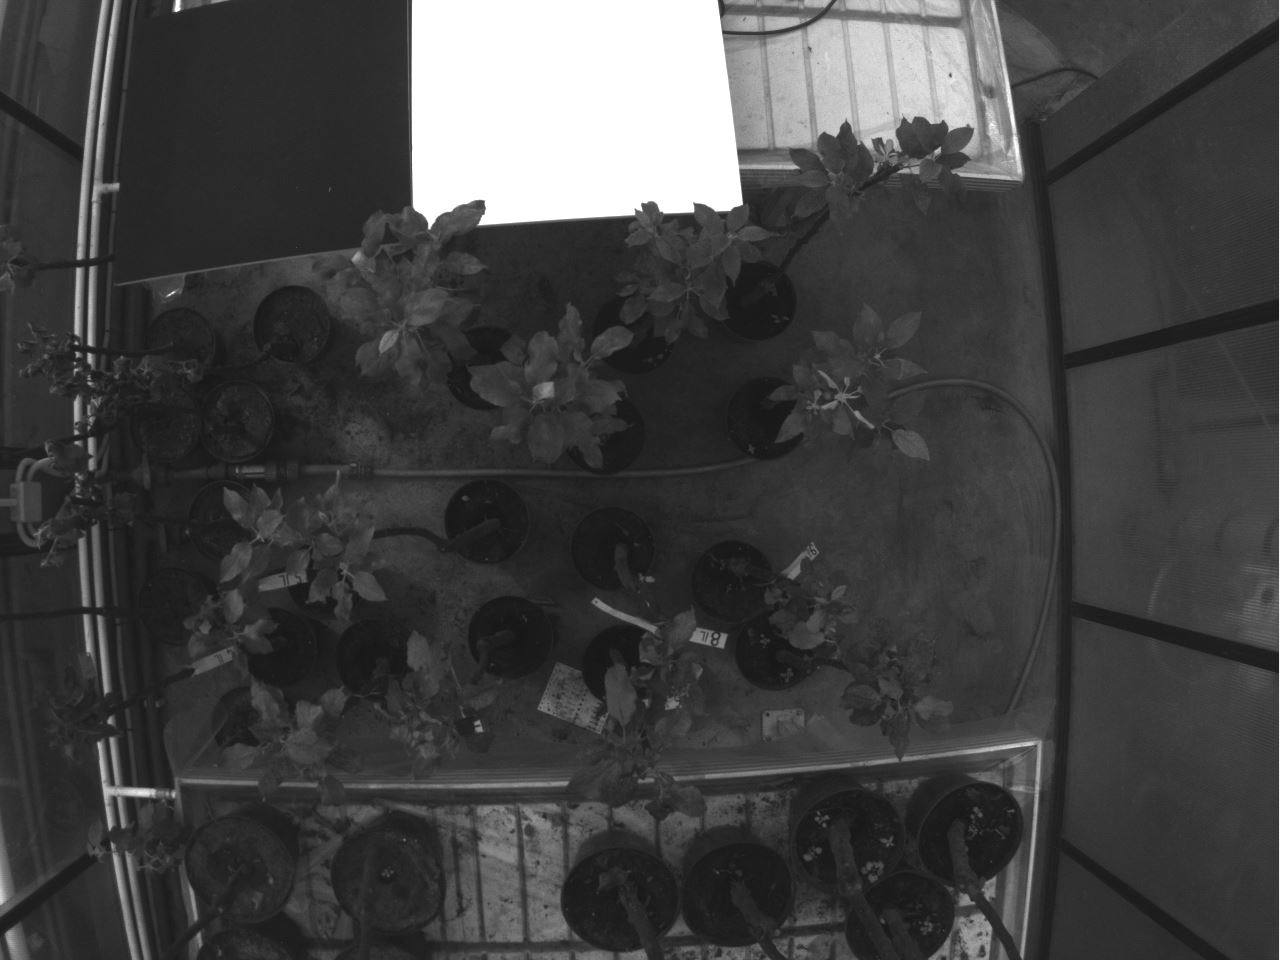
Healthy (H) and Infected (I) trees (lower group), 13th Day of Contagion. Spectral range 550nm |
Healthy (H) and Infected (I) trees (lower group), 13th Day of Contagion. Spectral range 660nm |
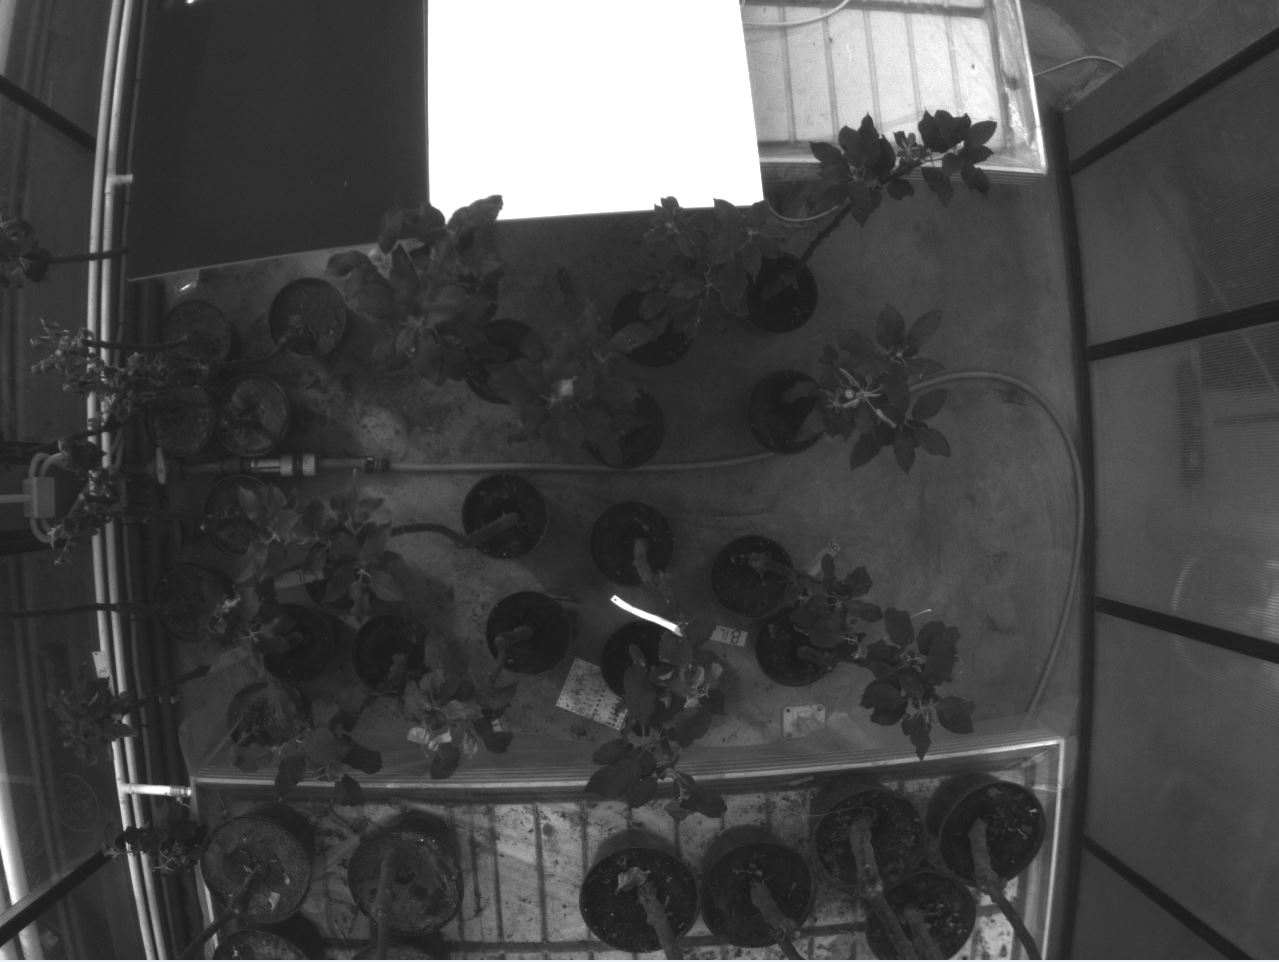
Healthy (H) and Infected (I) trees (lower group), 13th Day of Contagion. Spectral range 735nm |
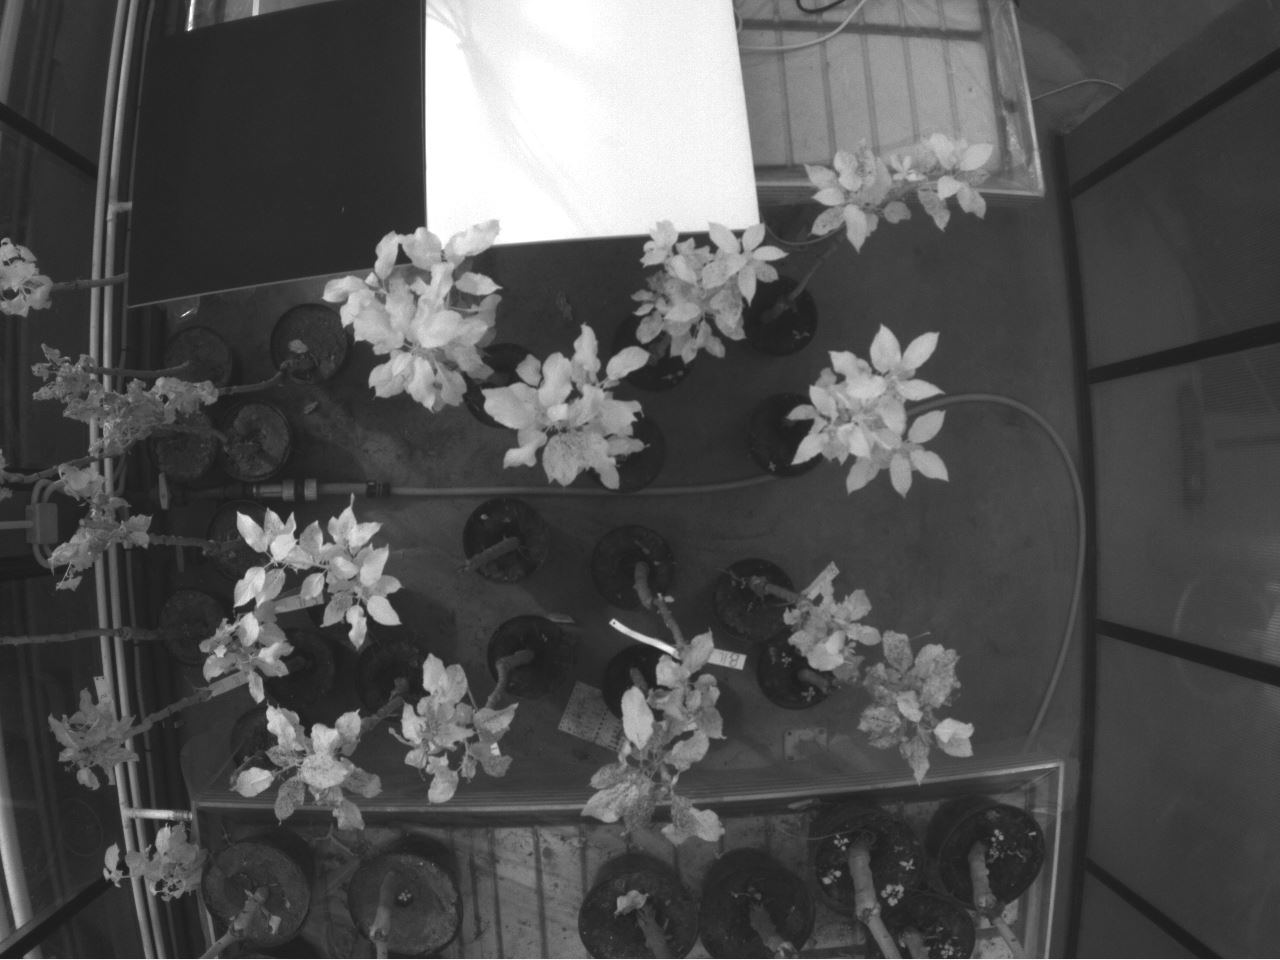
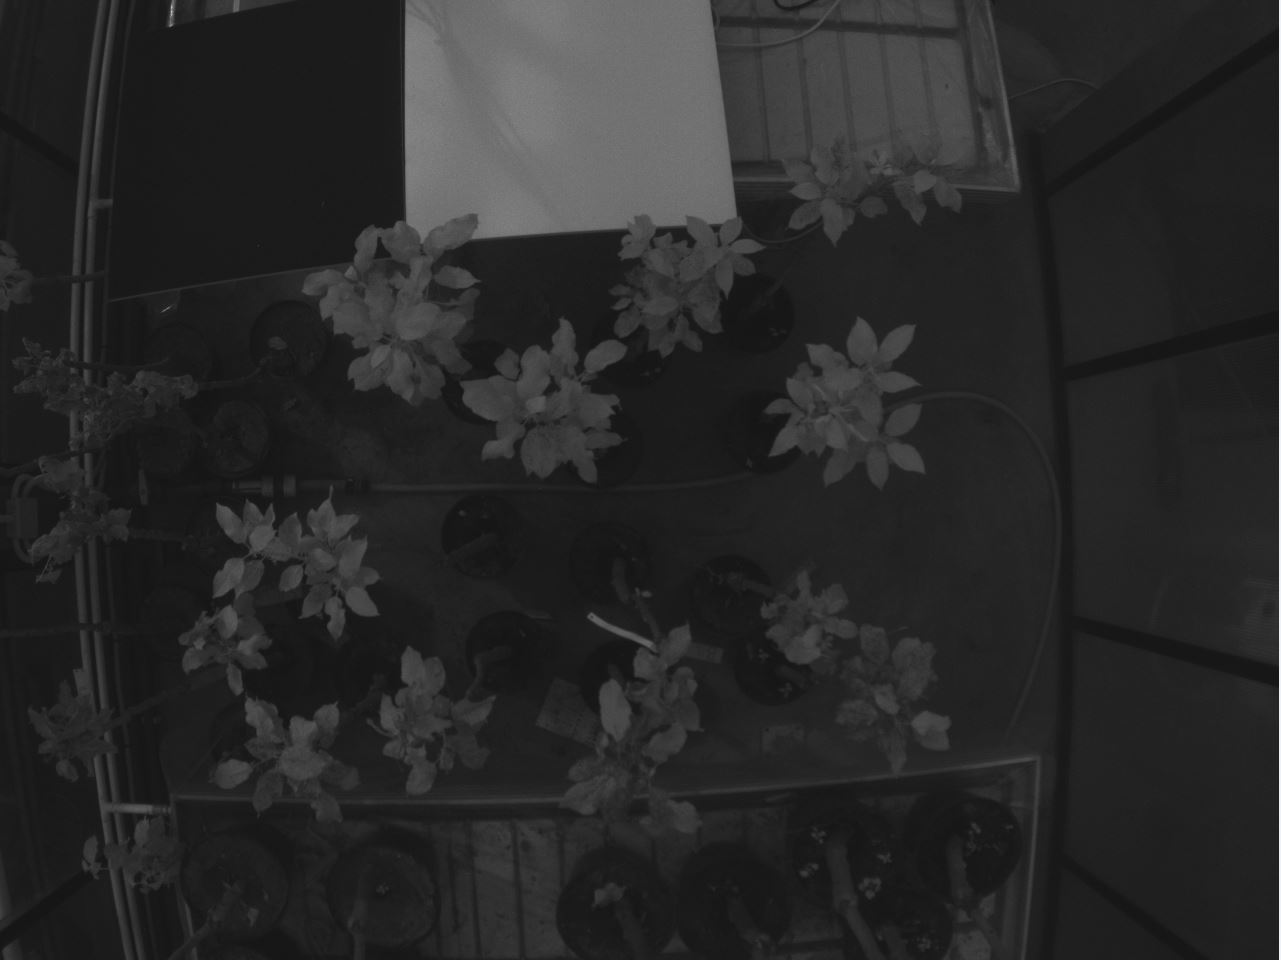
Healthy (H) and Infected (I) trees (lower group), 13th Day of Contagion. Spectral range 790nm |
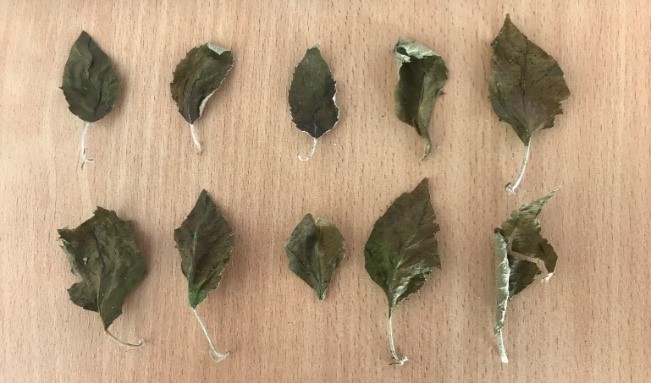
Infected (I) leaves – 13th August |